
Bank OREO Hits Its Highest Since 2020: Q2 2026 NPL Report
Q2 2026 call-report data: bank OREO at its highest since 2020, reserve coverage down from a 2023 record, first-mortgage delinquency up over two years.
Every quarter, U.S. banks and credit unions file a call report with their regulators. FIXnotes reads all of them: 4,313 bank filings and 4,299 credit-union filings for the quarter that ended June 30, 2026, the latest available. This report pulls out three trends that matter for anyone who buys, sells or finances mortgage notes. The data behind every chart is free to download at the end.
- OREO balances are rising again. Banks carried $4.9 billion of other real estate owned (OREO), the most since mid-2020 and up 89% from the late-2022 low, though still small relative to bank assets. The rise is steepest at banks under $10 billion.
- The reserve cushion has thinned since its 2023 record. Banks held $1.71 of loss allowance for every $1 of noncurrent loans, down from $2.24 in mid-2023, though it ticked up in the second quarter. Banks under $1 billion fell furthest.
- First-mortgage delinquency is higher than two years ago. At banks under $10 billion, noncurrent first mortgages rose from 0.54% to 0.71%. At credit unions, first mortgages 60+ days delinquent rose from 0.60% to 0.83%.
1. Bank OREO is at its highest since 2020
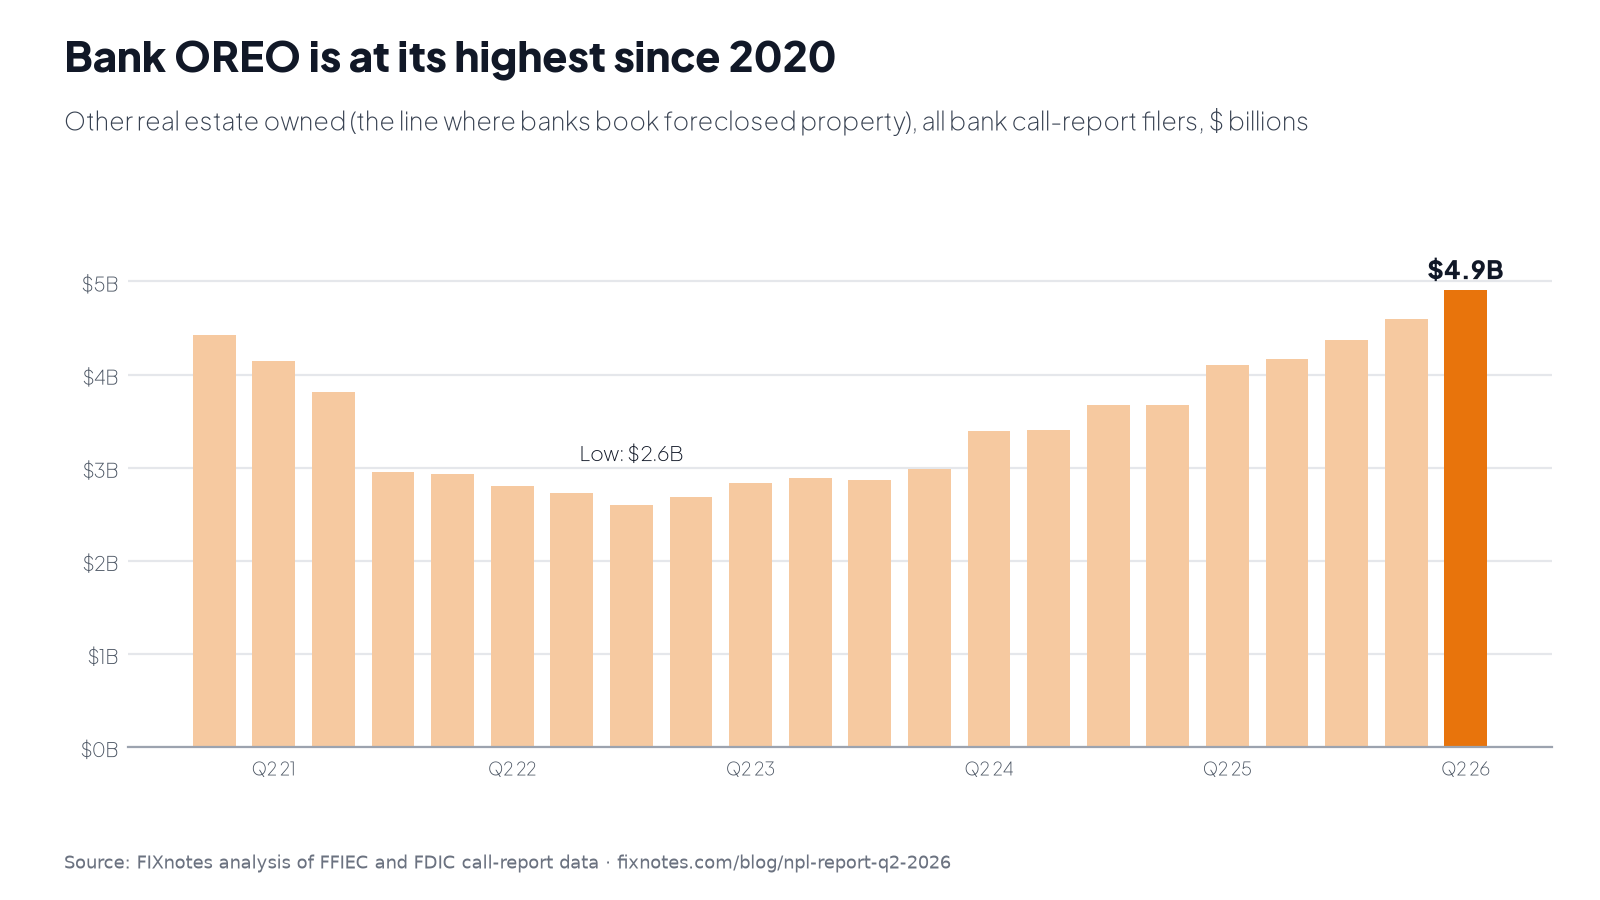
Other real estate owned is property a bank holds after taking it back from a borrower, generally through foreclosure or a deed in lieu. It can also include former bank premises. OREO is a quarter-end balance: it shows how much property banks are holding, not how much they took back or sold during the quarter.
U.S. banks carried $4.91 billion of OREO at June 30, 2026. The FDIC's own series shows OREO was last higher in mid-2020 ($5.02 billion), near the end of a decade-long decline from a 2010 peak of $53 billion. It bottomed at $2.59 billion at the end of 2022 and has climbed in almost every quarter since.
For perspective, OREO is still small: about 0.02% of bank assets. That's lower than in any quarter before the pandemic in the FDIC's data back to 1984 (0.03% at the end of 2019, and about 1% in 1991). The story is the direction, not the level.
Measured against each group's assets, the rise is steepest below $10 billion:
| Bank size (total assets) | OREO, Q4 2023 | OREO, Q2 2026 | OREO per $10,000 of assets |
|---|---|---|---|
| Under $300 million | $122M | $181M | $3.96 → $6.73 |
| $300 million to $1 billion | $290M | $550M | $3.48 → $6.92 |
| $1 billion to $10 billion | $612M | $1,529M | $2.55 → $6.05 |
| $10 billion and over | $1,843M | $2,647M | $0.91 → $1.14 |
Size groups are set by each bank's assets in each quarter, which is why the last column is the one to compare.
By property type, commercial real estate is the largest share of OREO and grew 69%. Multifamily OREO grew about ninefold from a small base. It's spread across 70 banks, though the five largest holders account for more than half.
| Property type | OREO, Q4 2023 | OREO, Q2 2026 |
|---|---|---|
| Commercial (nonfarm nonresidential) | $1,585M | $2,678M |
| 1–4 family residential | $750M | $1,066M |
| Construction and land | $426M | $679M |
| Multifamily | $47M | $438M |
| Farmland | $59M | $37M |
Property-type detail comes from each bank's call-report schedule of OREO. A few filers don't report the split, so the types sum to slightly less than the national total.
2. The reserve cushion has thinned since its 2023 record
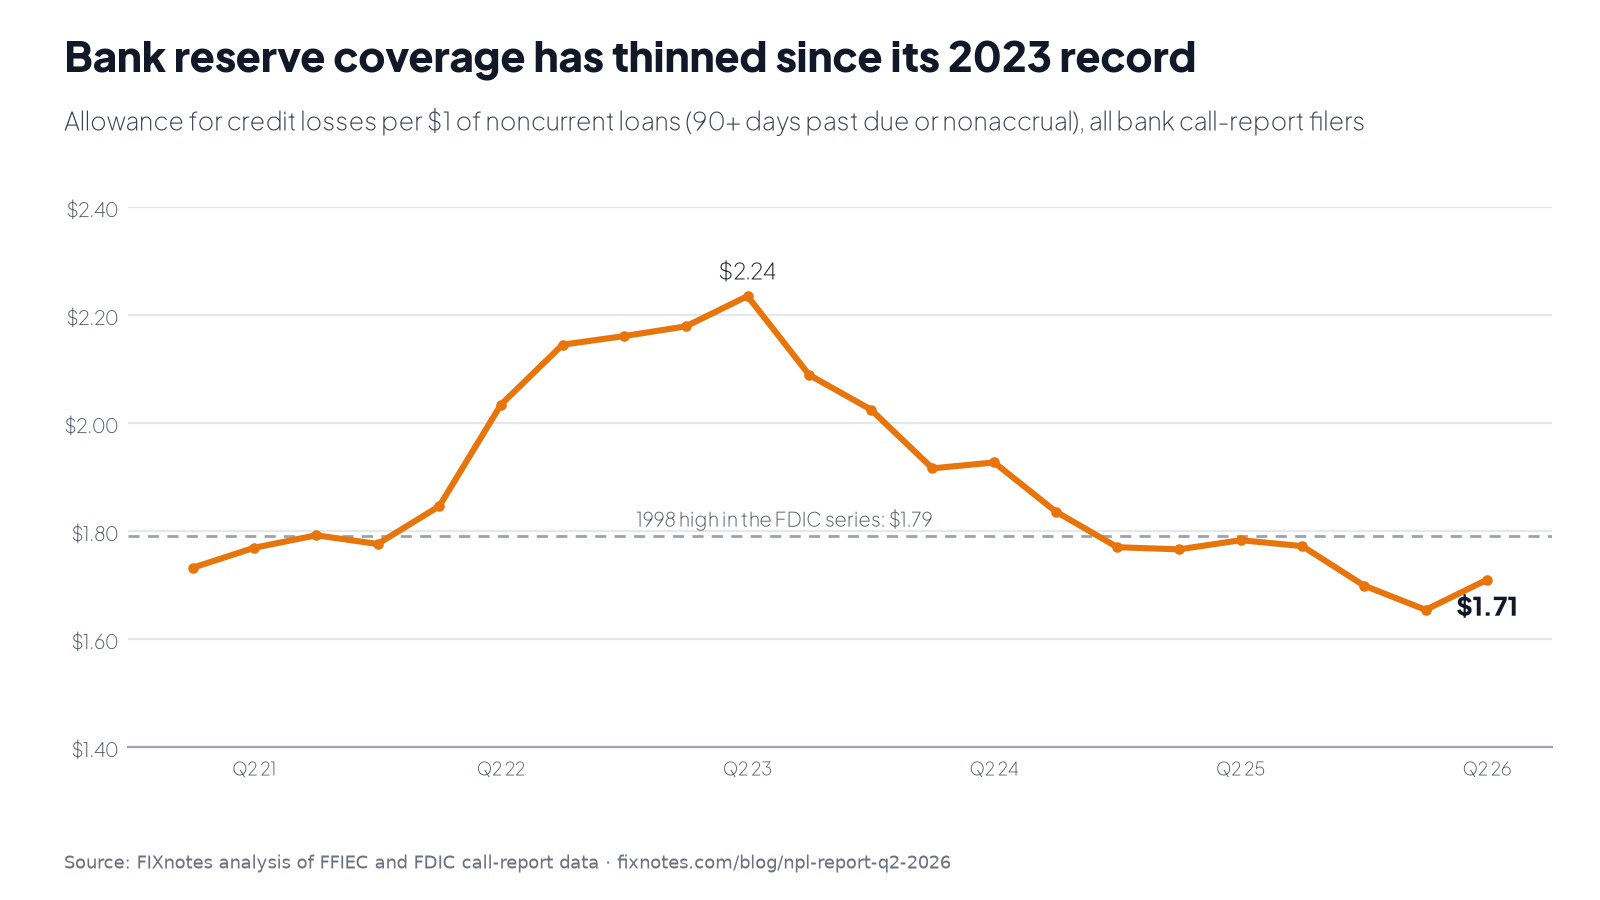
A bank's allowance for credit losses is the reserve it sets aside for loans it expects to lose money on. Coverage compares that allowance with noncurrent loans (90+ days past due, or no longer accruing interest).
At June 30, banks held $1.71 of allowance for every $1 of noncurrent loans, close to the FDIC's reported coverage ratio of 172.7%. That's down 23% from $2.24 in mid-2023, when the FDIC's coverage ratio hit its highest level in data going back to 1984. It ticked up in the second quarter, from $1.65, as noncurrent loans fell. Two things put the decline in context:
- It's a fall from a record, not to a record low. Coverage is still near the top of its 40-year range; before 2020 it peaked at 179%, in 1998. Allowances before 2023 followed older accounting rules, so long comparisons are approximate.
- Banks under $1 billion fell furthest. Most smaller banks adopted the CECL accounting standard in January 2023, which raised allowances just before the mid-2023 peak. On the FDIC's finer size groups, regional banks ($10 billion to $250 billion) fell nearly as far; only the largest banks held up.
| Bank size (total assets) | Q2 2023 | Q2 2026 |
|---|---|---|
| Under $300 million | $2.28 | $1.37 |
| $300 million to $1 billion | $2.72 | $1.42 |
| $1 billion to $10 billion | $2.30 | $1.47 |
| $10 billion and over | $2.21 | $1.76 |
More problem loans per dollar of reserve means more pressure to resolve them. A bank can work a loan out, foreclose, or sell it.
3. First-mortgage delinquency is higher than two years ago
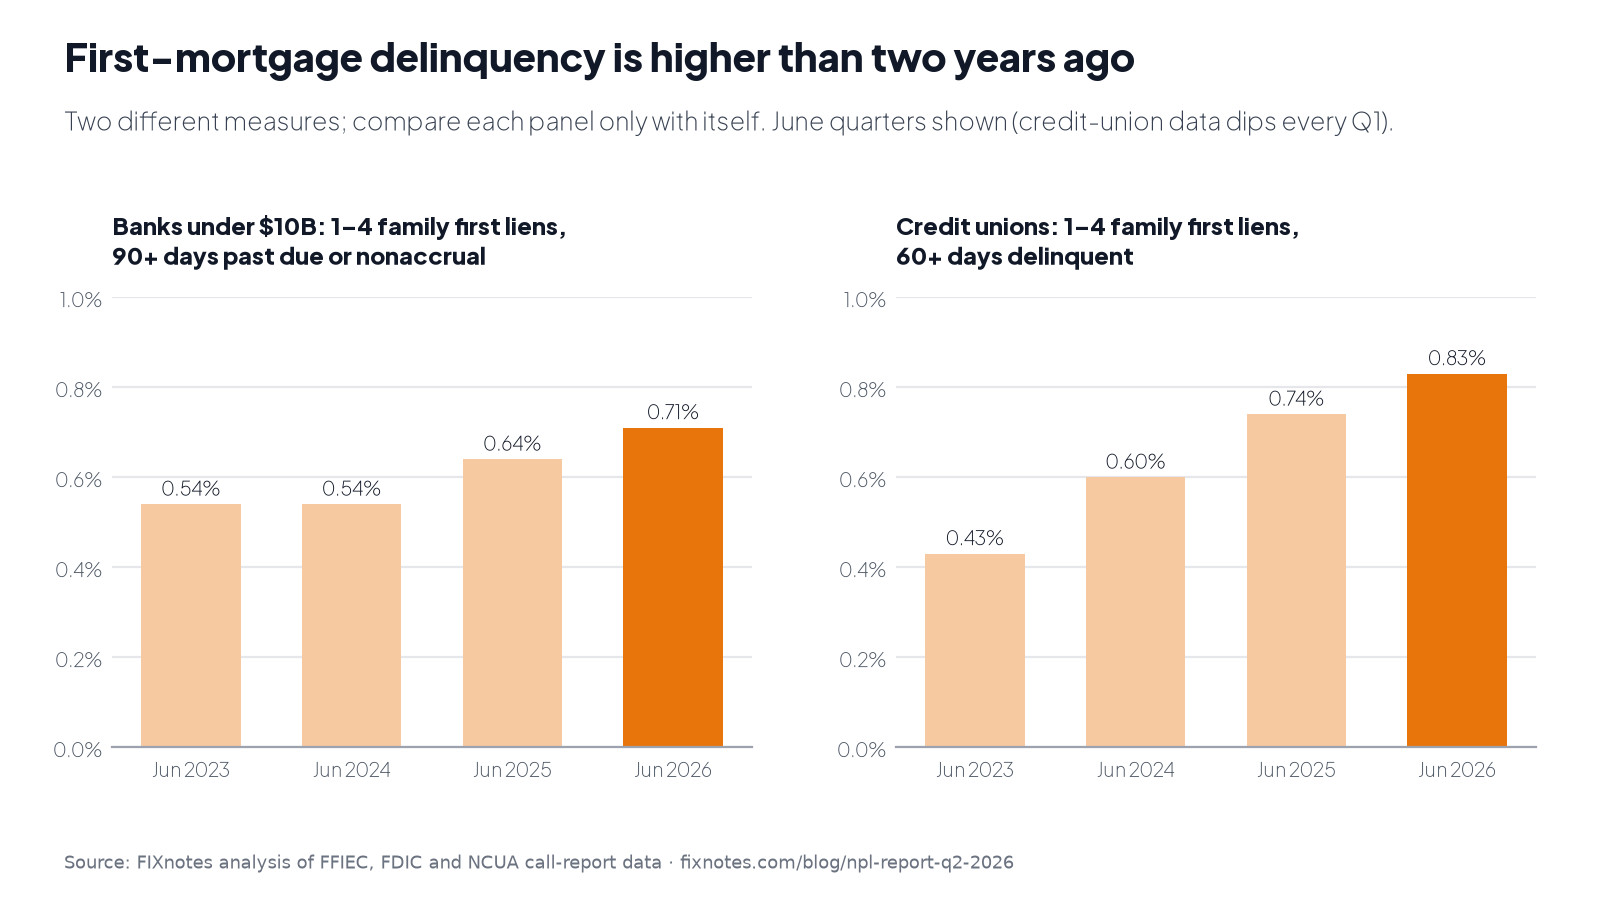
Banks and credit unions report delinquency differently, so the two can't be ranked against each other. Compare each one with its own history:
- Banks under $10 billion: closed-end first mortgages that are noncurrent (90+ days past due or nonaccrual) rose from 0.54% of balances in June 2024 to 0.71% in June 2026. The rate has held at 0.71% since December 2025.
- Credit unions: first mortgages 60 or more days delinquent rose from 0.60% to 0.83% over the same two years, and from 0.43% in June 2023. NCUA's own figure for all non-commercial real estate loans, a slightly broader group, is the same: 83 basis points. Credit-union delinquency dips every first quarter, so compare June with June.
The all-bank first-mortgage rate (1.40% in June 2026) is higher than the small-bank rate. That's partly because the largest banks hold government-guaranteed FHA and VA loans, which count as noncurrent but carry little loss.
What this means for note buyers
Loans that go noncurrent get resolved a few ways: they cure, they're worked out, they're charged off, or they're sold or foreclosed. A larger OREO balance means more foreclosed property is sitting on bank books. A thinner reserve cushion means each new problem loan weighs more on a bank's earnings. Both describe the pressure on the banks that sell distressed loans, which is why we track them quarterly.
To see which institutions are behind these numbers, the NPL Explorer ranks banks and credit unions on OREO, noncurrent loans and reserve coverage. To see loans for sale today, browse mortgage notes for sale.
Data, charts and how to cite
- Data: download the CSV. It covers 22 quarters, 2021 to 2026, for every series charted here. The first-mortgage series start in mid-2023.
- Charts: OREO, reserve coverage and first-mortgage delinquency. Free to republish with attribution.
- Cite as: FIXnotes Quarterly NPL Report, Q2 2026 (fixnotes.com/blog/npl-report-q2-2026), from FFIEC, FDIC and NCUA call-report data.
- Methodology: how we compute these numbers, with sources, definitions and limits.
- Questions or corrections: support@fixnotes.com.
The next report follows the Q3 2026 call-report data, which regulators publish in late November and early December.
Take the free Note Investor Workshop — analyze a training loan modeled on a real deal, then submit practice offers on loans that actually sold. No credit card.